There was a time when sports commentary relied almost entirely on what the eye could see and the box score could tell. A batting average, a touchdown count, or a rebound tally made up the bulk of the narrative. Today, that’s no longer the case. Modern sports are fueled by sports analytics, with real-time data collection driving insights that shape player performance, game strategy, and fan engagement.
From the thunderous hits of the cricket to the intricate footwork of soccer and the tactical precision of NFL, every top-tier sport now runs on a massive engine of sports data analytics. This engine isn’t just recording final scores — it’s generating performance metrics, predicting outcomes with machine learning, and providing richer storytelling for sports fans worldwide.
The Tools of the Trade: How Data Is Collected
Sports data comes from multiple data sources, combining technology and human expertise. These are the foundations of modern performance data.
Imagine a network of high-speed, high-resolution cameras installed strategically around an arena or stadium. These aren’t just for broadcasting the game; they’re working overtime, tracking the precise position of the ball and every single player on the field or court, often 25 times per second.
- How it Works: Systems like Second Spectrum in the NBA or similar technologies used in Soccer/Football for Goal-Line Technology and advanced player movement analytics use computer vision to identify and follow each individual.
- The Data Harvest: From this, analysts can extract player speed, the distance covered by each athlete, the separation distance between offensive and defensive players, and the exact trajectory of the ball. This forms the backbone of metrics like “miles run per game” or “average defensive pressure.”
2. Wearable Technology: The Athlete’s Silent Partner
While you might not always see them, many professional athletes are practically cyborgs on the field, wearing discreet devices that collect vital biometric and movement data.
- How it Works: Small GPS or LPS (Local Positioning System) devices are often placed in vests worn by players under their jerseys during practice and even games. Companies like Catapult Sports are pioneers in this field.
- The Data Harvest: These devices capture critical insights into player workload, heart rate during peak exertion, acceleration and deceleration bursts, and even help predict potential injury risk. While rarely shown on TV, this data is gold for coaches and sports scientists, informing training regimes and helping to manage player fatigue.
3. Manual & Event Data Collection: The Human Element
Despite all the high-tech wizardry, there’s still a crucial role for human intelligence in data collection. Highly-trained analysts, often called “taggers,” watch the game live or via video feeds and meticulously record every single event on the field with a timestamp and precise coordinates.
- How it Works: In Cricket, analysts meticulously log every ball bowled—its line, length, speed, and the resulting shot or wicket. In Soccer, Opta analysts might tag every pass, tackle, foul, and touch for every player. The NBA uses similar methods for detailed assist types or identifying effective off-ball screens.
- The Data Harvest: This human-curated data provides granular insights into passing accuracy, successful tackle rates, specific shot locations on goal, detailed pitch maps, and bowling economy rates. It’s the essential layer that adds context to the raw positional data.
Sport-Specific Examples: How Data Shapes Games
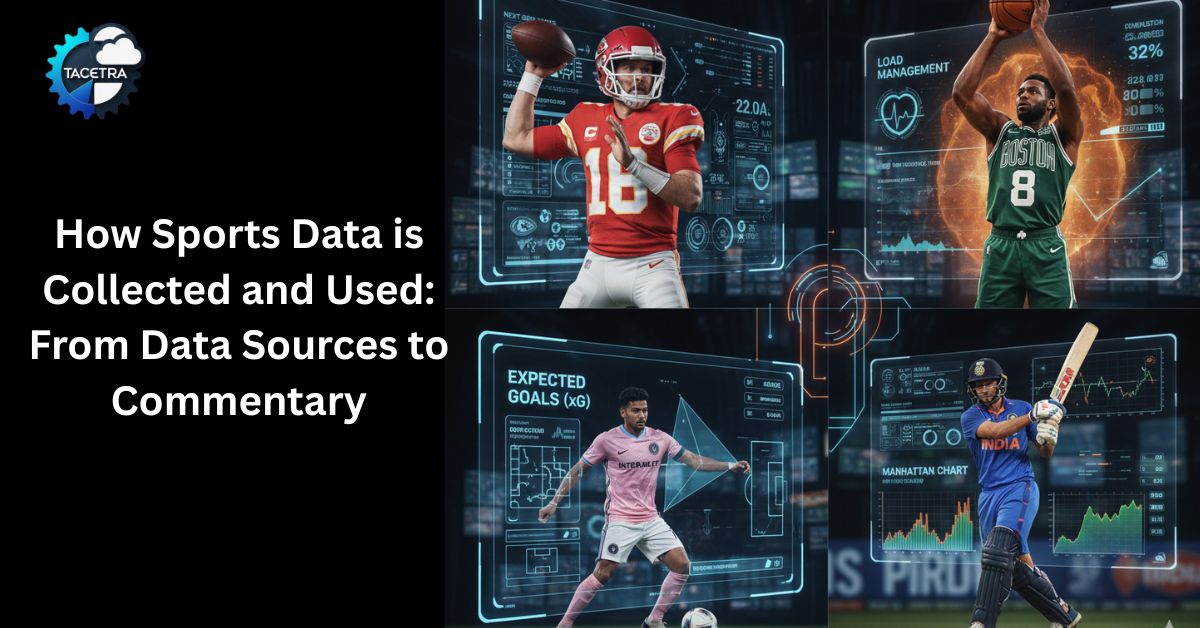
Soccer (Football): The Rise of Expected Goals (xG)
Metrics like Expected Goals (xG) have transformed how fans and analysts understand scoring chances. xG measures the likelihood of a shot resulting in a goal, factoring in distance, angle, and defensive pressure.
Example: Inter Miami CF, boosted by Lionel Messi, often draws attention. A commentator might say: “Messi’s curling shot had an xG of just 0.12 — only a 12% chance of scoring. That shows the brilliance of the finish.”
NBA: Load Management and Performance Optimization
The NBA uses both optical tracking and wearable technology to manage workloads over its grueling season. Performance data helps teams balance minutes and reduce injury risk.
Example: The Boston Celtics monitor player tracking to optimize stars like Jayson Tatum. If sprint distances drop by 15% over several games, coaches adjust training and game plans accordingly.
NFL: Next Gen Stats and Completion Probability
The NFL leverages tracking data from RFID sensors to power Next Gen Stats. These metrics reveal insights about passing accuracy, separation, and pressure.
Example: The Kansas City Chiefs, led by Patrick Mahomes, showcase this data weekly. A commentator might note: “That pass had only a 32% Completion Probability, yet Mahomes and his receiver turned it into a highlight-reel play.”
Cricket: Hawk-Eye and Performance Charts
Cricket blends tradition with innovation. Technologies like Hawk-Eye and UltraEdge help with umpire decisions, while data visualizations such as Worm Charts and Manhattan Charts enhance storytelling.
Example: The Indian National Team often features these analytics in broadcasts. A commentator might explain: “The Manhattan Chart shows India’s scoring dried up between overs 10–15, when spinners took control of the game.”
The Narrator’s Edge: How Commentators Use Data
Commentators now rely on data management systems and broadcast analytics hubs to turn raw tracking data into digestible insights for sports fans.
- Pre-Game Narratives: Stats help set storylines, like a team’s win percentage when leading at halftime.
- In-Game Storytelling: Real-time speed metrics or performance data confirm hustle plays or expose fatigue.
- Contextualizing Events: Metrics like xG or run-rate explain why dominance doesn’t always mean goals or wins.
Example: A broadcaster might highlight: “He just clocked 22 mph — his fastest sprint this season — showing why he’s so crucial in transition defense.”
Challenges in Sports Data Collection
- Accuracy & Reliability: Cameras may lose line-of-sight, and wearables can produce noisy signals.
- Latency: Real-time systems may still run a few seconds behind live action.
- Privacy Concerns: Biometric data and health tracking raise ethical questions.
- Accessibility: Cutting-edge sports analytics tools are often limited to elite teams with budgets.
The Future of Sports Data Analytics
The future of sports data analytics is expanding quickly:
- Machine learning models predicting outcomes, injuries, and tactical moves.
- Virtual reality replays where fans can relive plays with overlaid performance metrics.
- Data science tools for managing historical data and integrating multiple data sources.
- More emphasis on fan behavior and fan engagement, tailoring broadcasts and in-stadium experiences.
Conclusion: The Future Is Data-Driven
Sports data analytics is no longer a background tool — it’s a central force driving performance, safety, and fan engagement. From wearable technology monitoring heart rate to machine learning models shaping game strategy, the combination of tracking data, event data, and biometric data is redefining how we experience sports.
Whether it’s Messi’s improbable goal, Mahomes’ tight-window completion, or India’s run-rate collapse, sports fans are now part of a richer story told through data. And as virtual reality, AI, and data science advance, the invisible player on the field will only get stronger.
Further Reading: Aspiring Coders’ Career Guide: From Novice to Pro Journey
Discover more from TACETRA
Subscribe to get the latest posts sent to your email.